1960: Annexation
Of 51,230 residents in 1960, 10,893 lived in areas annexed since 1950.
10,893 of 51,230 residents in 1960 lived in areas annexed since 19502

The record
Early 1950s
By the early 1950s Tyler has issued more than $6 million in building permits, mostly in new subdivisions beyond its prewar neighborhoods, platted near highways on the southwest, west, northwest and southeast edges of town.1
1955
National Homes, which the Pollard nomination calls the largest prefabricated home company in the country, opens a plant in north Tyler; about 540 of its houses go up in Tyler and Smith County between 1955 and 1975.1
1960
Of Tyler’s 51,230 residents, 10,893 live in areas annexed since 1950. The city’s 1950 area has gained only 1,369 people.2
1960s
Most of the land Tyler annexes lies to the south, stretching the city. In the 1960s it annexes stretches of highways 69 and 271, which give the city limits their bug-shaped outline.3
1940 to 1980
Tyler adds roughly 28 square miles, mostly along its southern and western edges, according to the Pollard nomination citing The Tyler Loop.1
1990
Tyler covers 39.7 square miles of land, with 1,900.5 people per square mile.4
2011 and 2012
Tyler annexes Tyler Pounds Regional Airport in 2011 and the UT Health Science Center the next year.3
Notes
National Register nomination, Pollard Residential Historic District (2026) (atlas.thc.texas.gov). Research notes
1960 Census of Population, Vol. 1, Part 45 Texas, Table 9, 1960 population of areas annexed between 1950 and 1960 (p. 45-42) (www2.census.gov). Research notes
The Tyler Loop (Chris Groskopf), These eight maps show how annexation shaped Tyler, from 1940 to today (June 8, 2017) (thetylerloop.com). Research notes
1990 Census of Population and Housing, Population and Housing Unit Counts, Texas (CPH-2-45), Table 9 (www2.census.gov). Research notes
About this plate
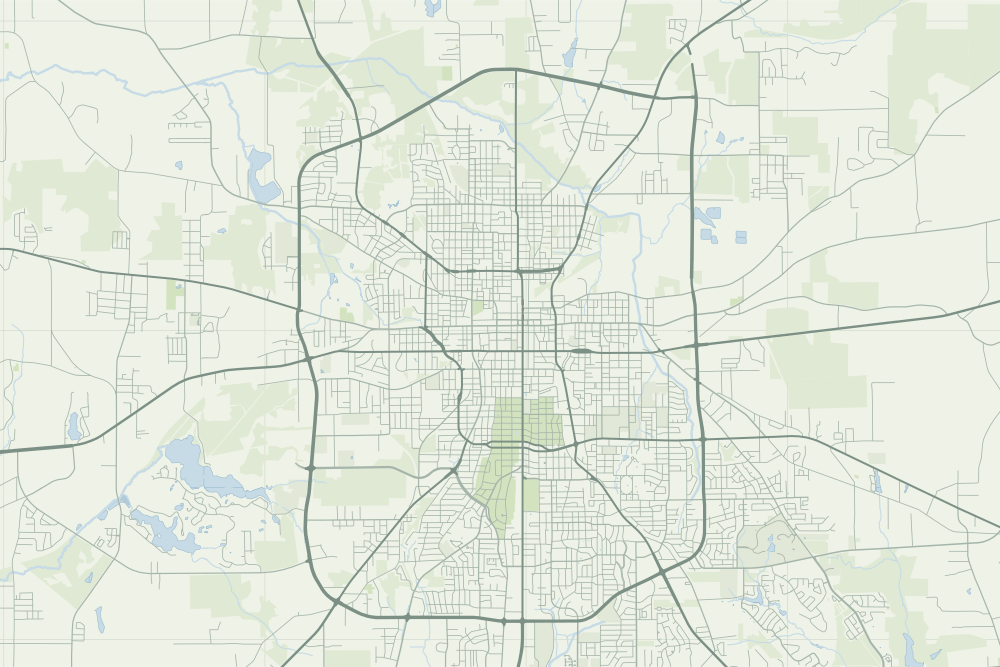
- Our sources describe the annexed areas in words, not as lines, so the map draws no city limits.
- Under the plate, the USGS map, 1948 (the 1:62,500 quadrangle, around Tyler). It is placed by the survey's own coordinates, moved by the mean offset of 6 street crossings that still exist; checked against them, it is off by about 11 m downtown. How the old maps are placed.
- The faint linework is today’s map, from OpenStreetMap. How the map is made.